Table of Contents
Risk Knowledge
The risk assessment we propose for the areas under investigation partly follows the Swiss Risk Assessment Model (BAFU 1998). In this section, we shortly summarise the steps we took in order to assess the hazard on site. For other sites, the steps will be slightly different, but we propose the main approach to be similar.
In our pilot project in Medellín, three scenarios are distinguished: a scenario with a return period of up to 30 years and a low intensity (smaller event, most likely to happen), a scenario with a return period of appr. 100 years and a medium intensity (medium-sized event, less likely to happen) and a scenario with a return period of 300 years or more and a high intensity (big event, very unlikely to happen). The first and second scenario are defined as high hazard, the third scenario is defined as residual hazard, since these events are very unlikely to occur. The following steps were taken to assess the probability and size of potential landslides and, therefore, the hazard in all parts of the study area.
Mapping of Past Events
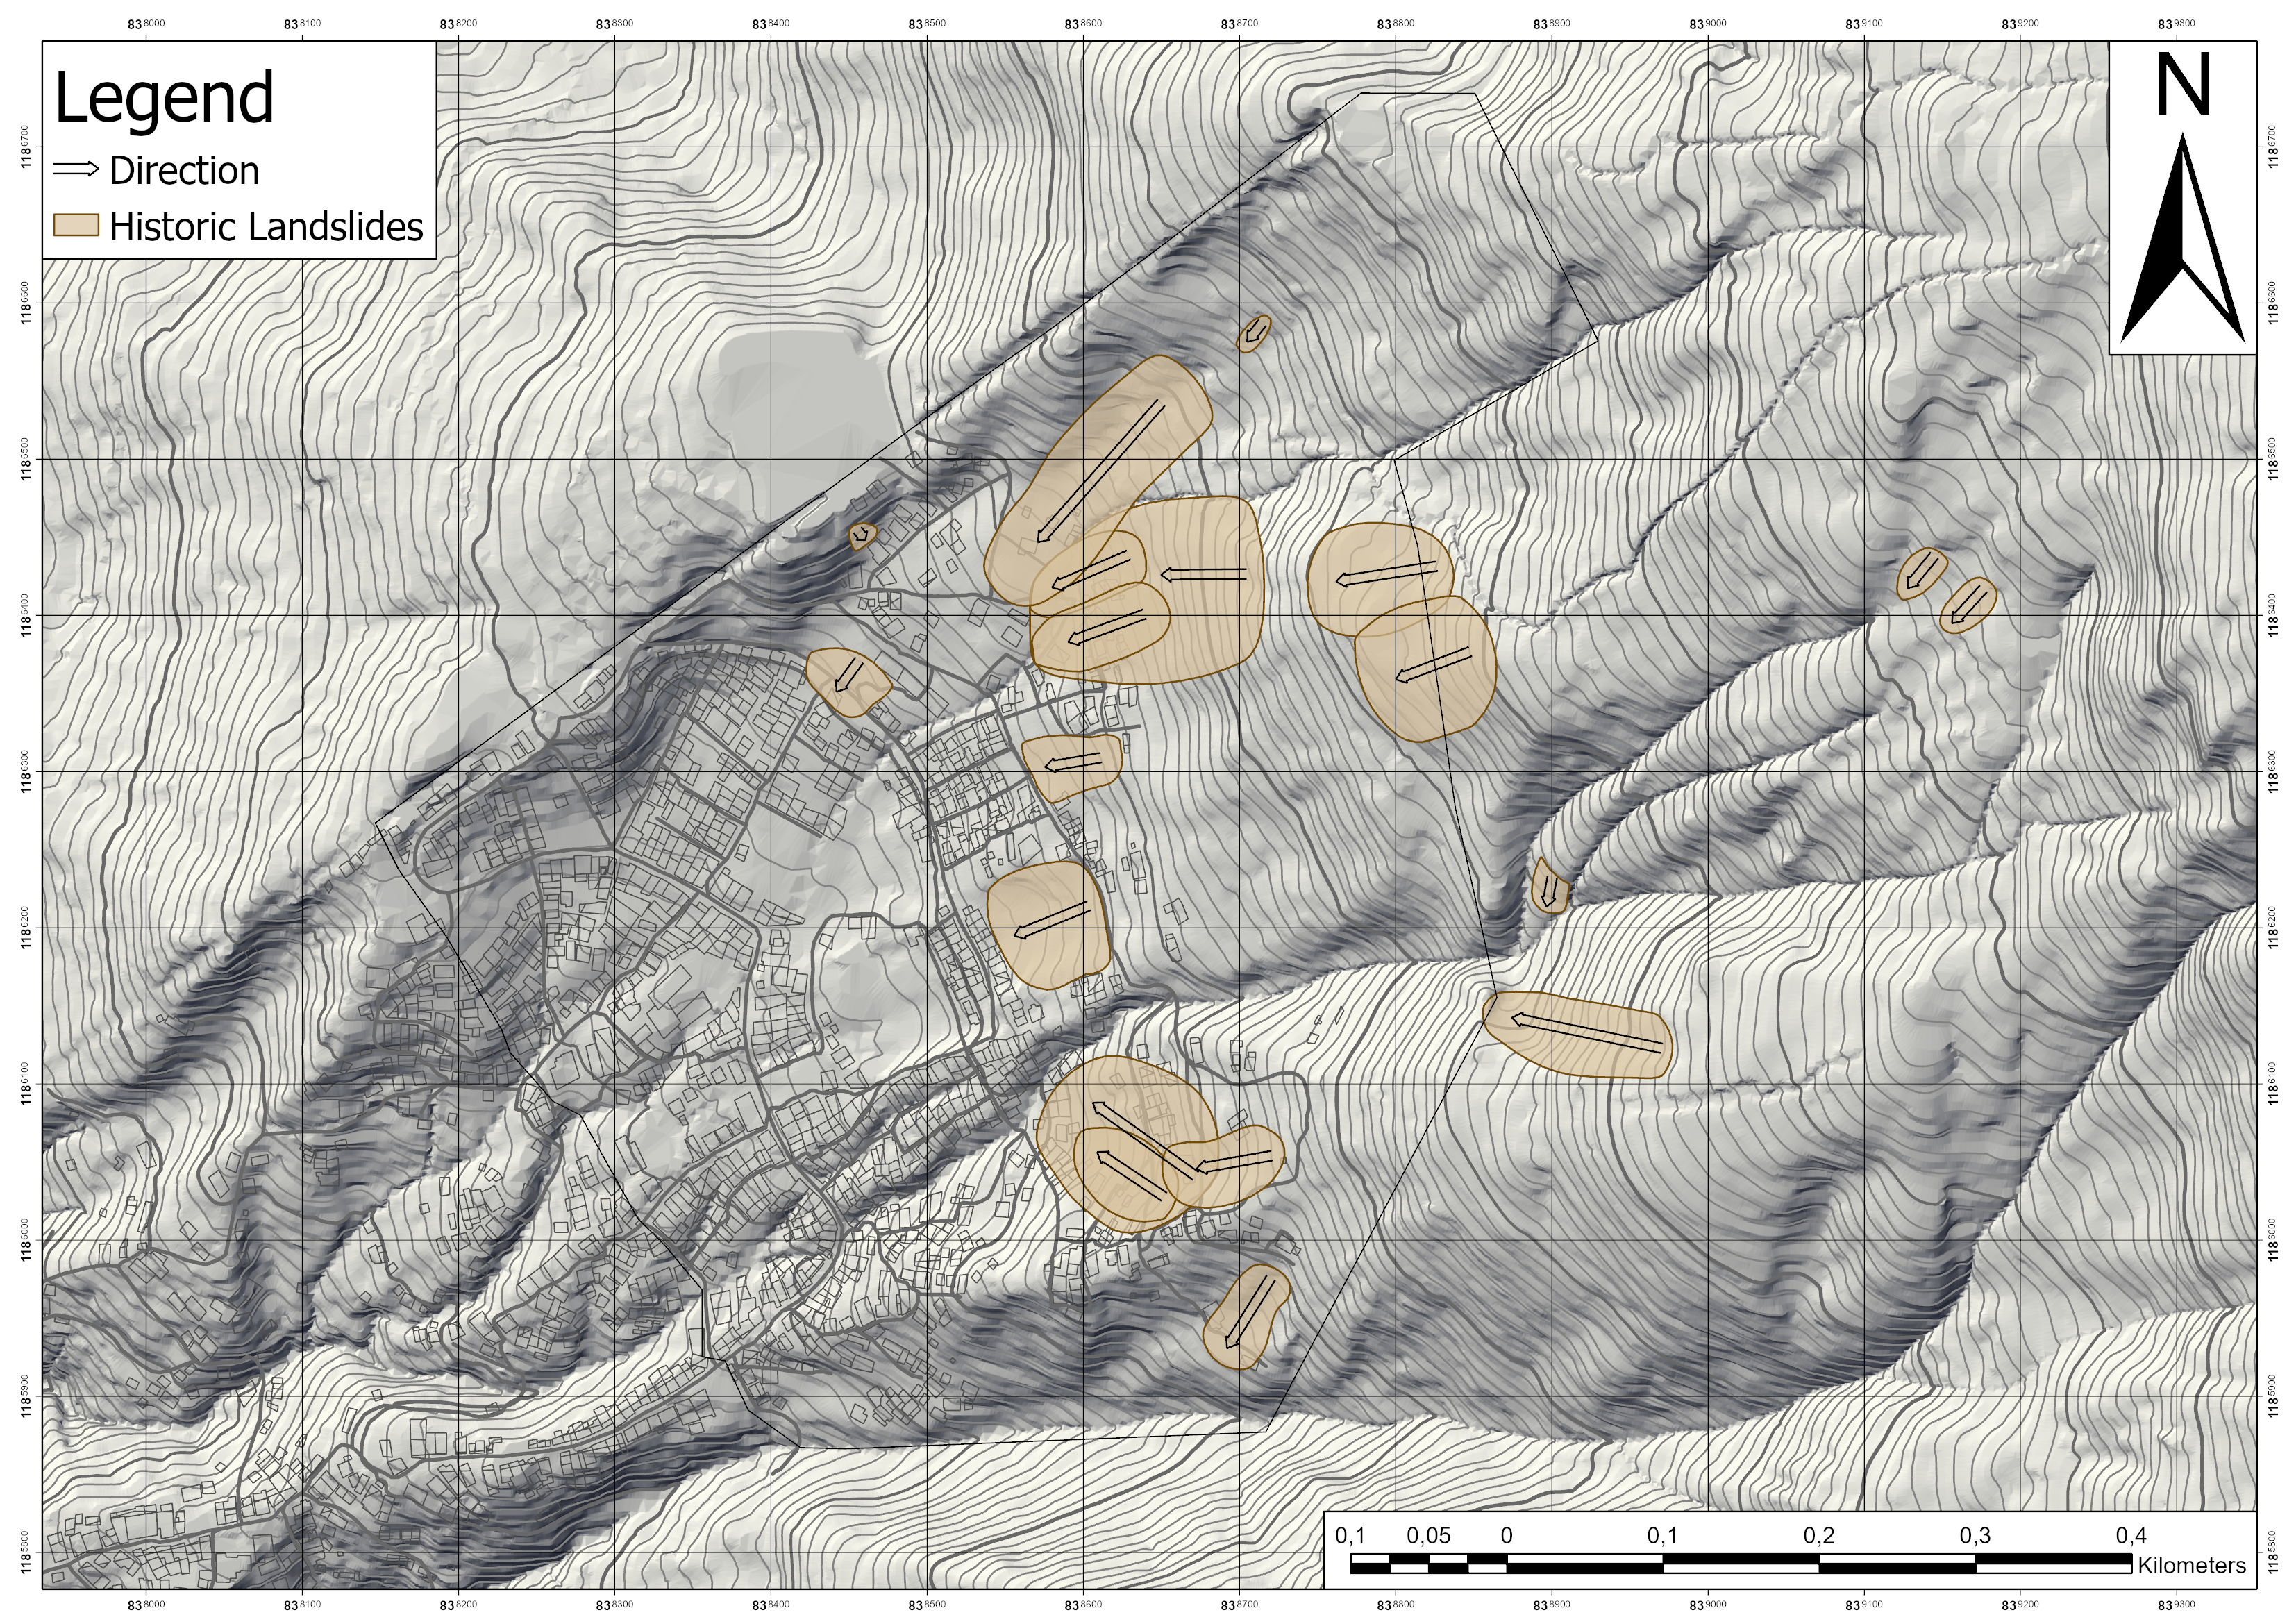
To understand and define the typical events happening in Bello Oriente, past landslides still visible on the surface were mapped. Additionally, community members gave input on past events not visible anymore due to intense construction in the barrio.
The resulting landslide map depicts all landslides recorded.

Definition of Scenarios
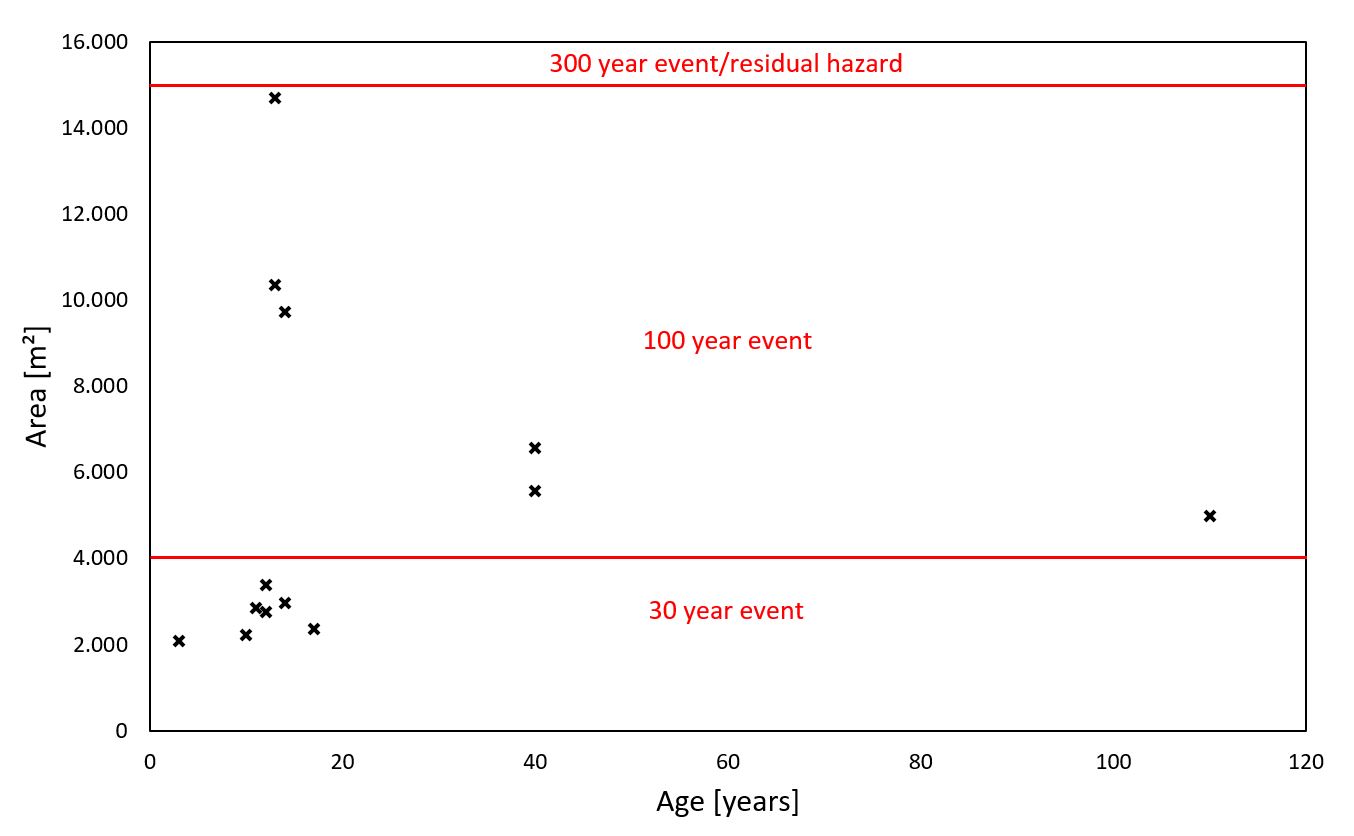
All mapped events were plotted with size against age and divided into three groups representing the three scenarios. A landslide representing the 300 year event or residual hazard was not mapped. Therefore, its dimensions can only be presumed.
 30 year event:
- area of up to 4000 m²
- length of appr. 50 m
- depth of up to 10 m
100 year event:
- area of 4000 - 15000 m²
- length of appr. 150 m
- depth of 10 m
Residual Hazard (complex failure):
- area of more than 100000 m²
- length of appr. 500 m
- depth of 10 - 30 m
Modelling of Selected Events
Several of the events mapped in August 2019 (landslide map) were used for backmodelling. Different parameters influencing the behavior and shape of a landslide (depth and shape of the sliding surface, sliding angle etc.) were changed throughout the modelling process. This allowed for the determination of the most probable ranges of values of these parameters, that could have shaped the modelled landslide. The parameters and values determined by the backmodelling were then used to model possible future landslides in Bello Oriente, including the possible runout of those events.
Hazard Map
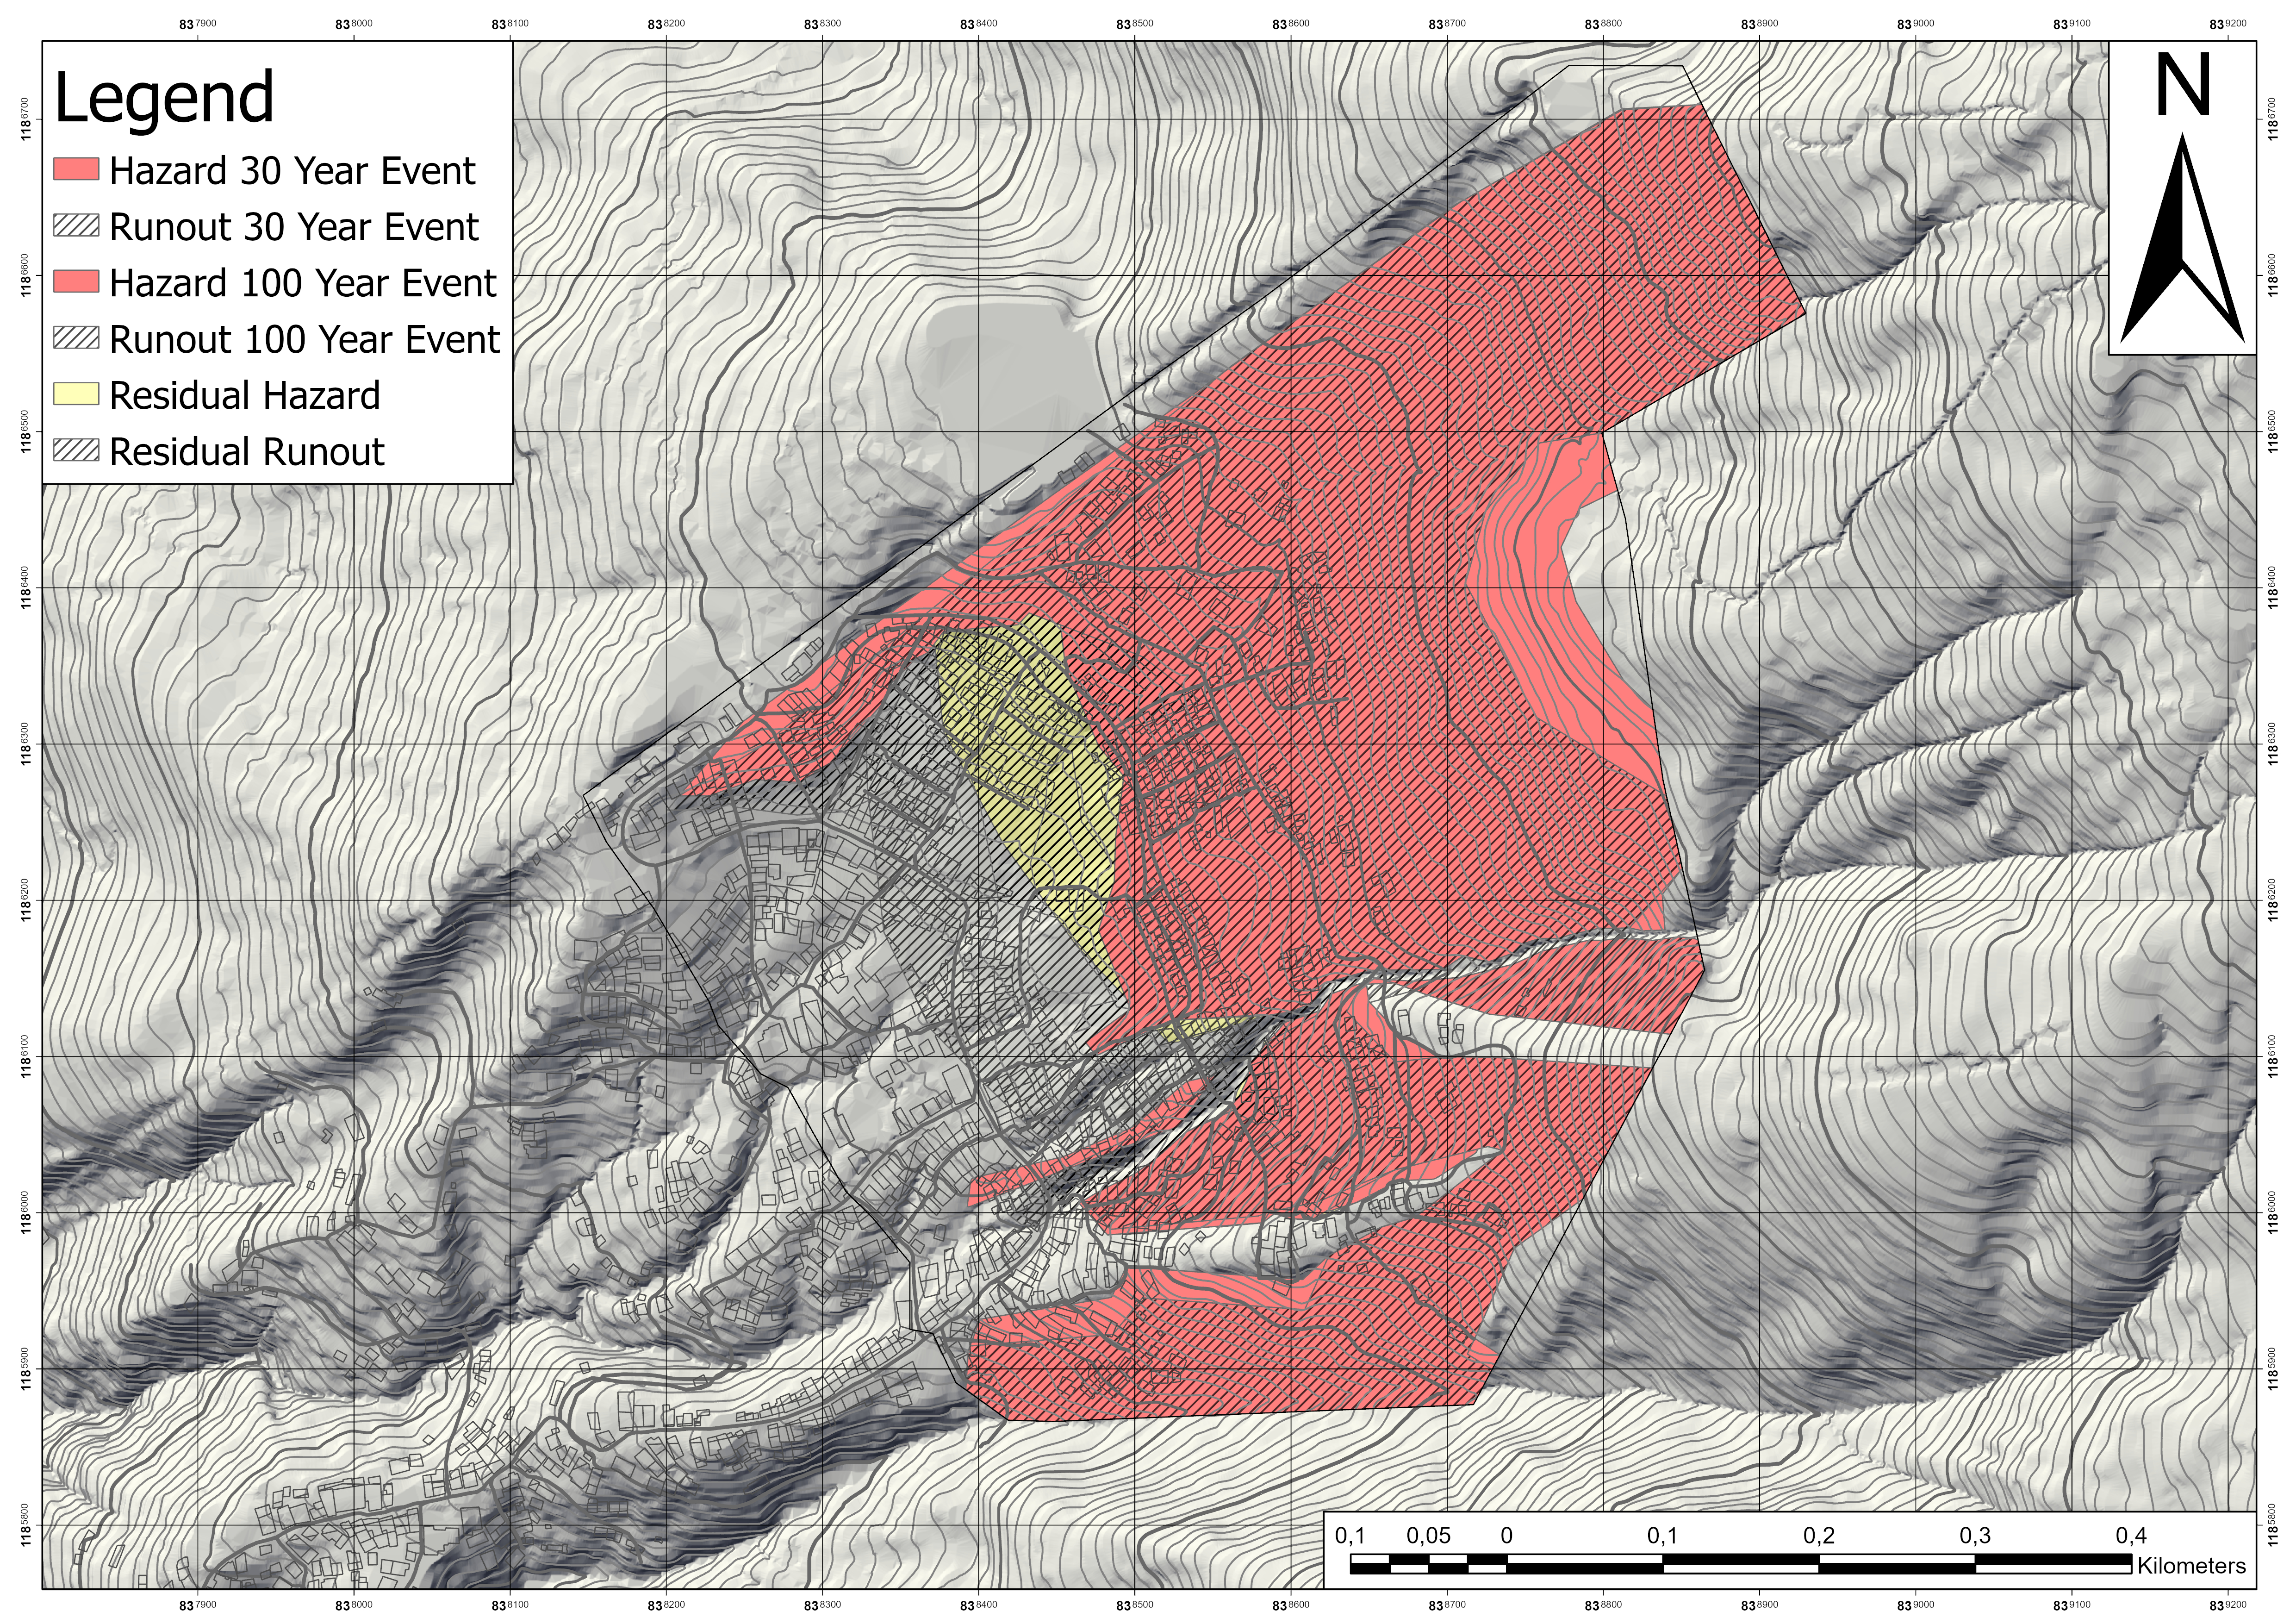
The results from the modelling in combination with the slope angle and the geology were visualized in a hazard map. The 30 year event hazard zone and the 100 year event hazard zone are depicted in the same color (red), since both are defined as high hazard. The residual hazard is depicted in yellow.
Most steep areas above the inhabited zone down to the uppermost road of Bello Oriente are in the high hazard/high risk zone. The runout of a possible event could even reach the main road of the barrio.

